Public company comparables. @ Irrational Exuberance
Hi folks,
This is the weekly digest for my blog, Irrational Exuberance. Reach out with thoughts on Twitter at @lethain, or reply to this email.
Posts from this week:
-
Public company comparables.
-
How to filter out old email from inbox
Public company comparables.
A few years ago I wrote about reading a Profit & Loss statement, which is a foundational executive skill. I also subsequently wrote about ways to measure your engineering organization. Despite having written those, I still spend a lot of time wondering about effective ways to represent an engineering organization to your board of directors.
Over the past few years, one of the most useful charts I’ve found for explaining an R&D organization is a scatterplot of R&D spend as a % of margin versus YoY growth of last twelve months (LTM) revenue. Unlike so many other measures, this is an explicit measure of your R&D organization value as an investment relative to peer organizations.
Until recently, I assumed building this dataset required reading financial filings but my strategic finance partner at Carta, Tyler Braslow, pointed out that you can get all of this data for the tech section from Meritech Analytics, for free.
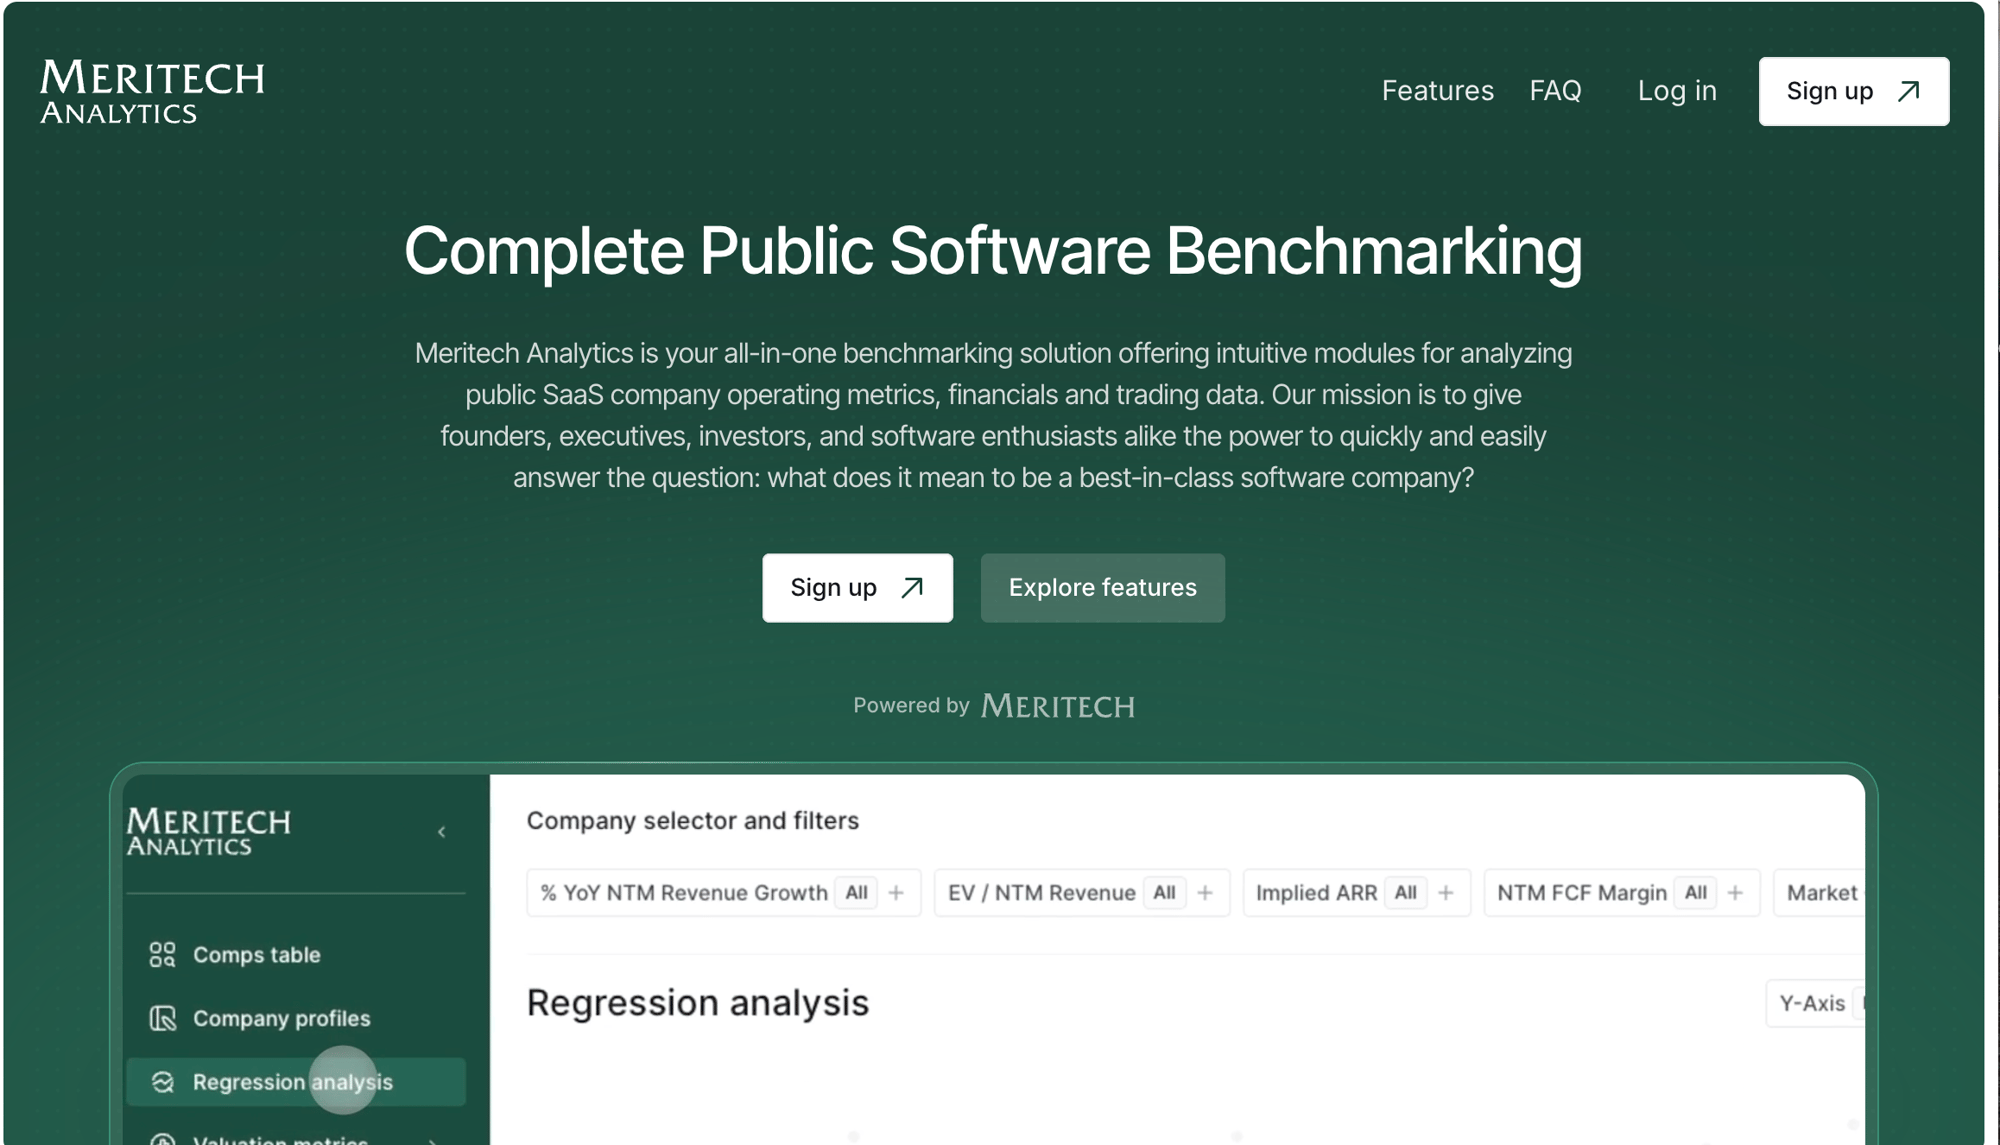
When you login to Meritech, you’re dropped into a table of public company comparables for tech companies. This is the exact dataset I’d been looking for to build this chart.
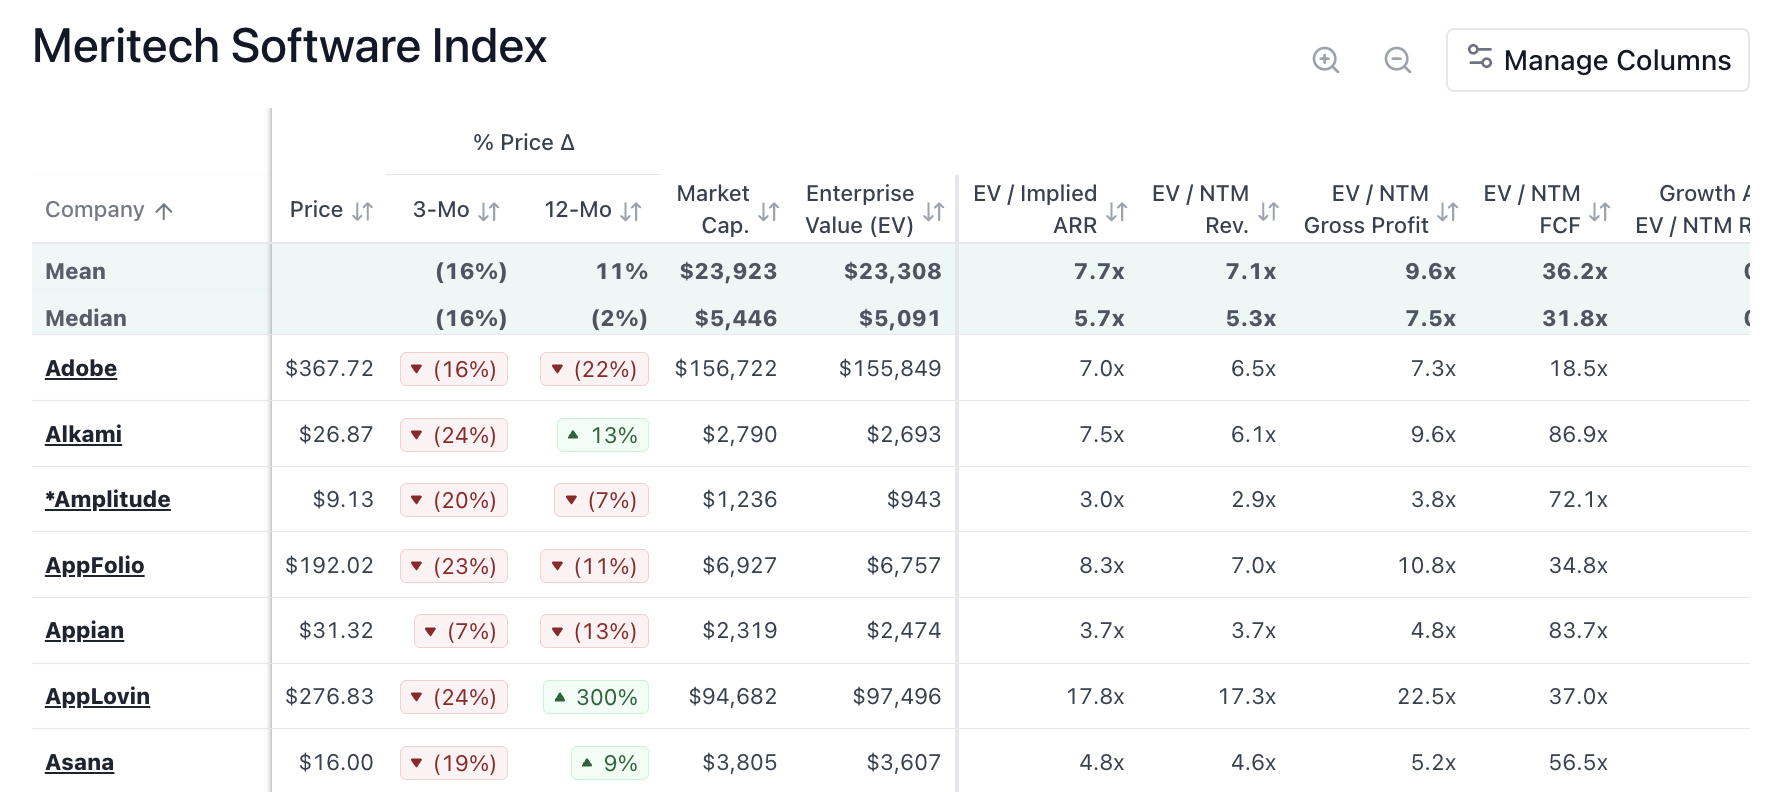
After logging in, you can then copy the contents of that table into a Google Sheets spreadsheet or Excel, or whatever you’re most comfortable with.
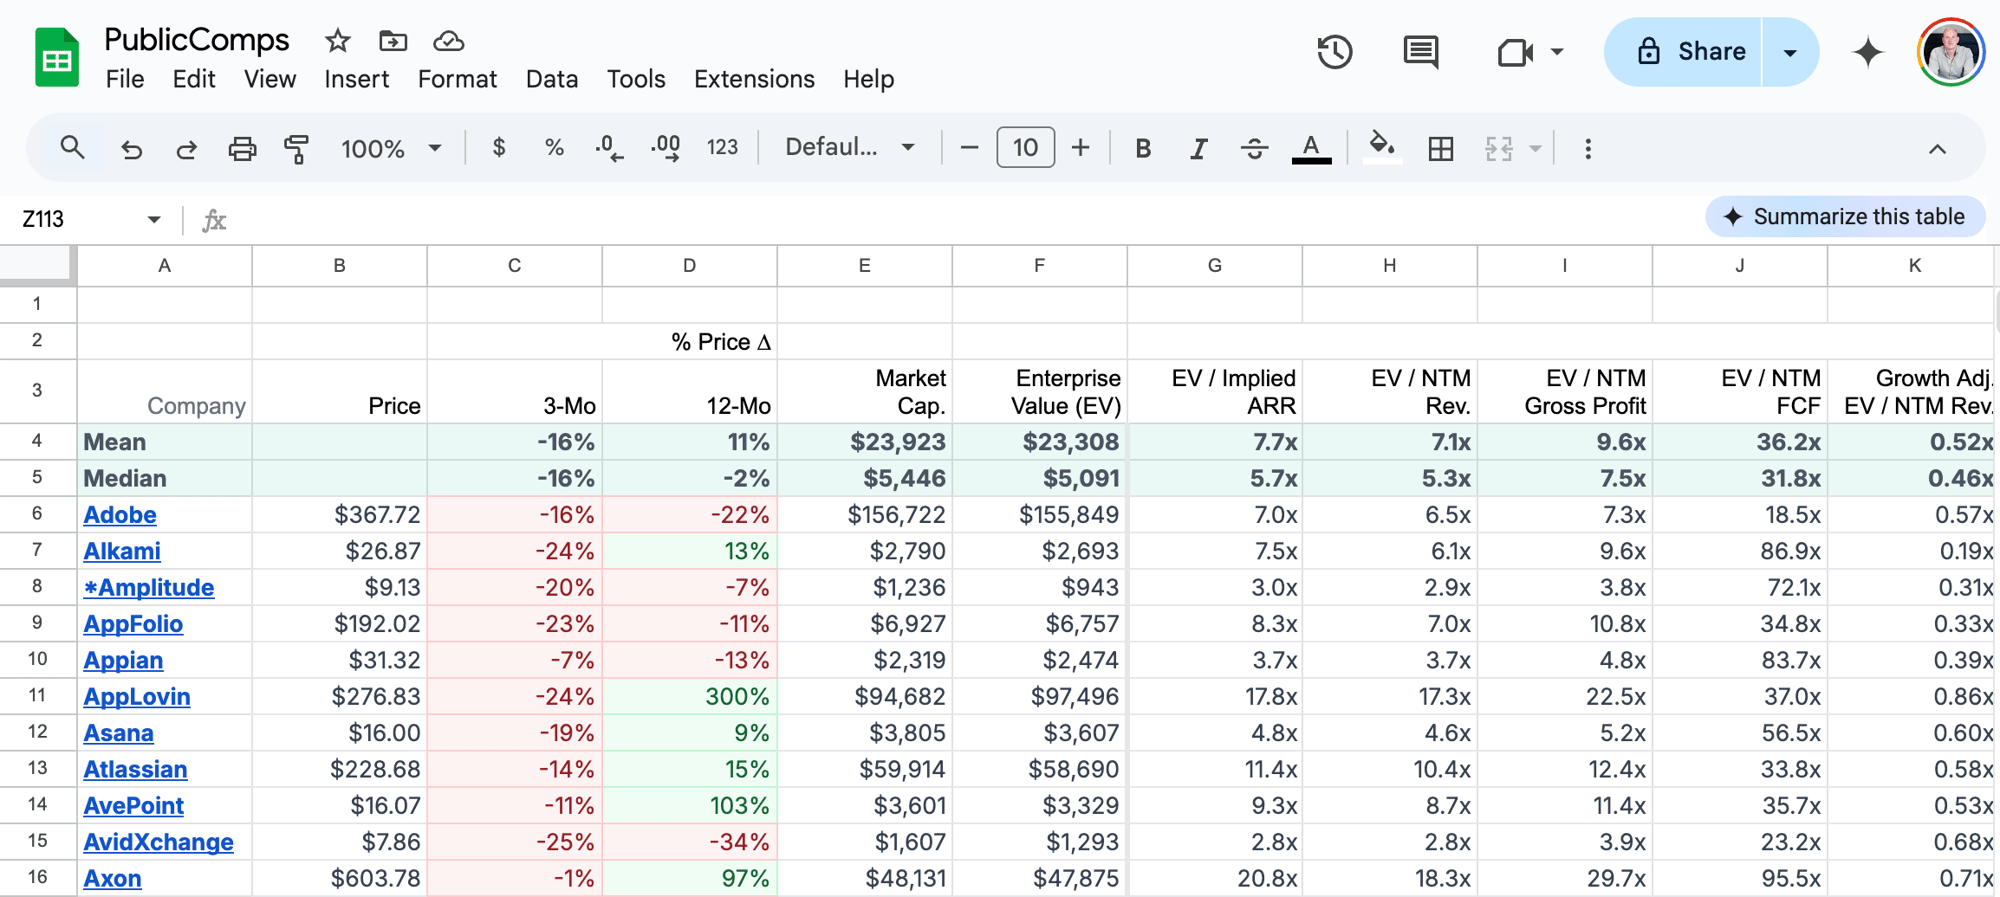
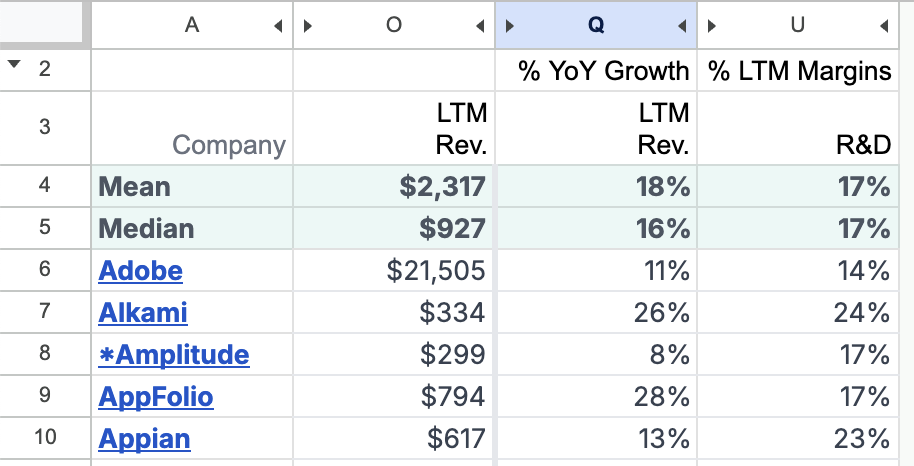
Within that sheet, the columns you care about are:
- % YoY Growth LTM Rev (column
Qfor me) – how much “last twelve months revenue” has grown year over year, as a percentage - % LTM Margins for R&D (column
Ufor me) – how much R&D spend is as a percentage of last twelve months margin - LTM Revenue (column
Ofor me) – although I don’t show this in the scatterplot, I find this one useful for debugging outlier values
Hiding the other columns gives you a much simpler table.
From that table, you’re then able to build the scatterplot. Note that being “higher” means your R&D spend as a percentage of LTM margin is higher, which is a bad thing. The best companies are to the bottom and to the right; the worst companies are to the top and to the left.
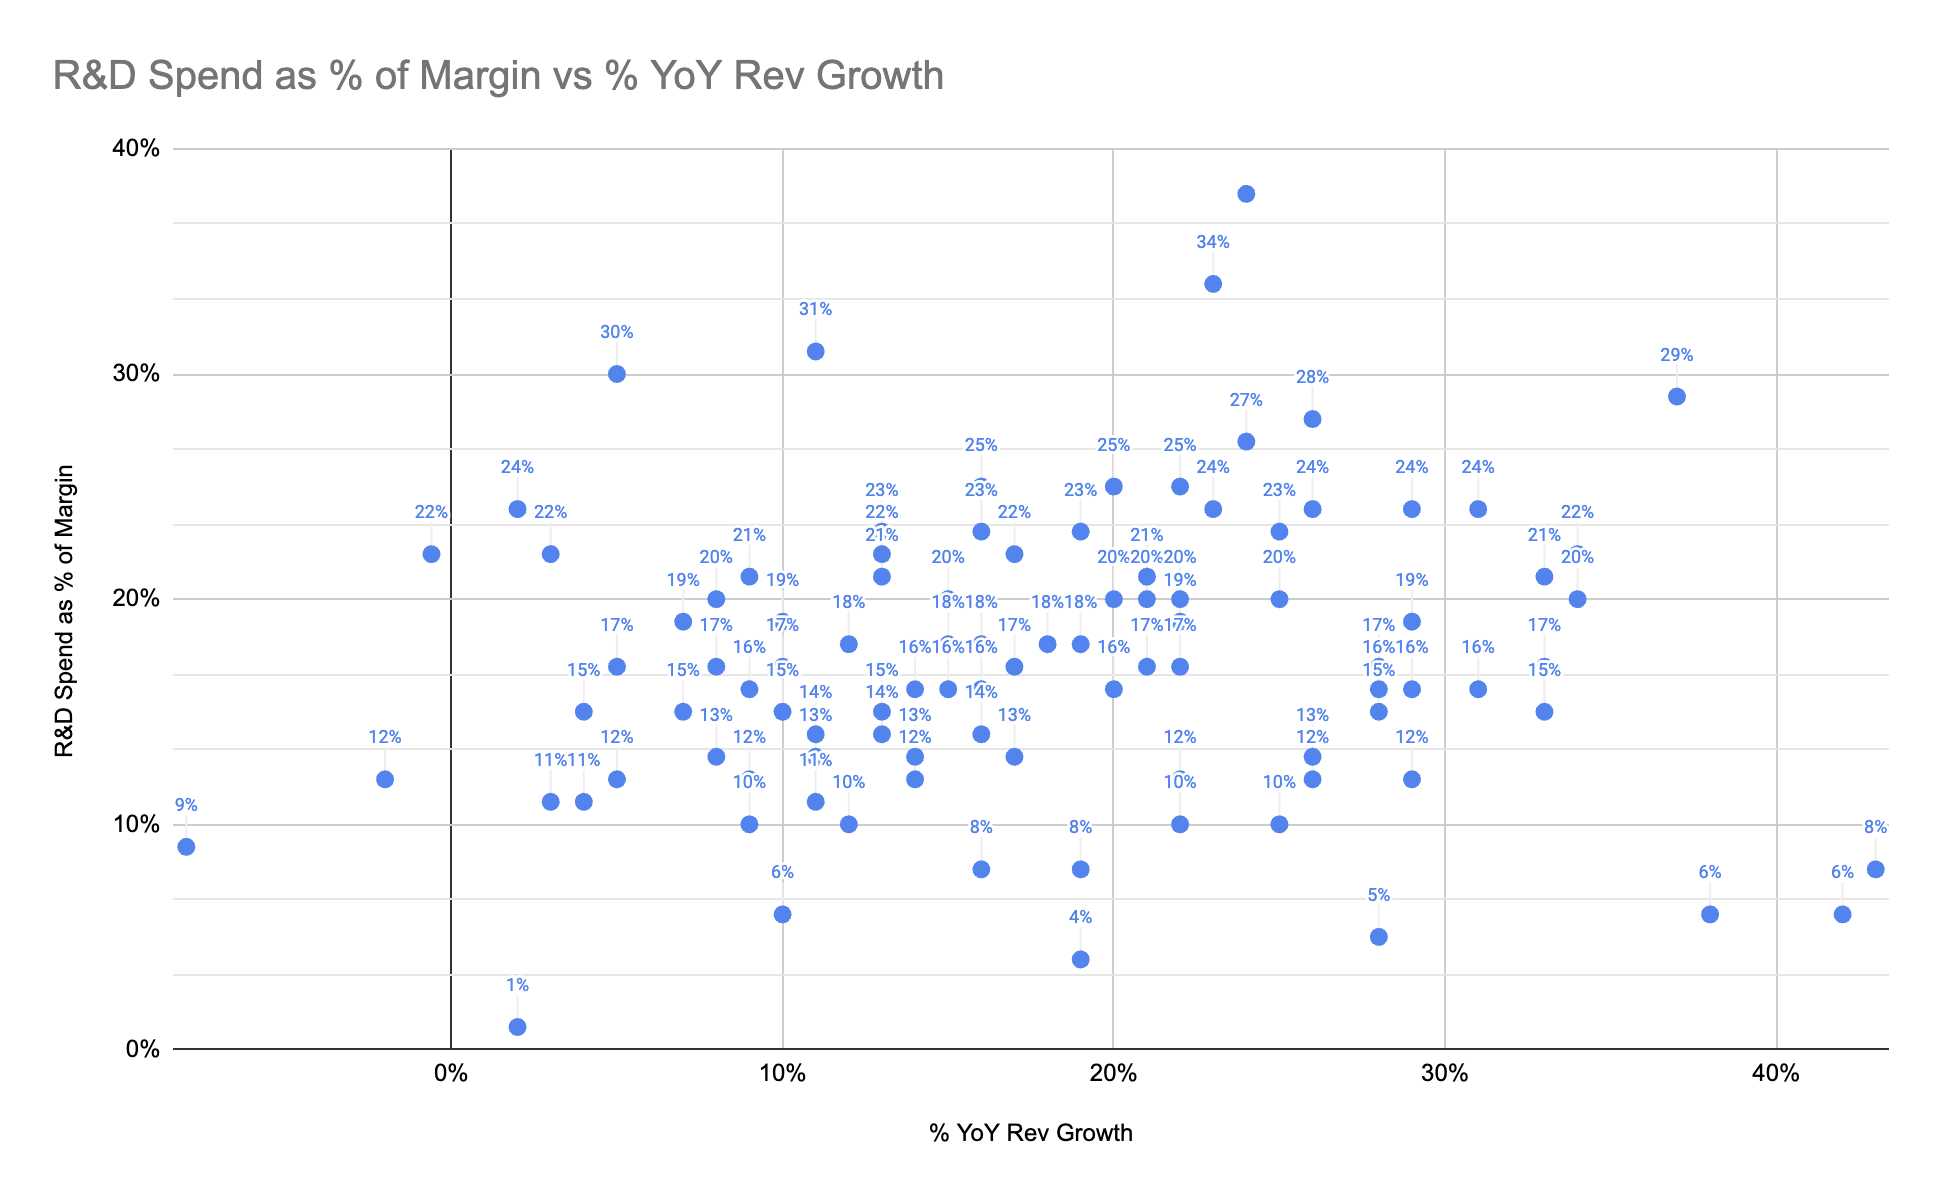
With this chart as a starting point, you can then plot your company in and show where you stand. You could also show how your company’s position in the chart has evolved over time: hopefully improving. Finally, you might want to cull some of these data points to better determine your public company comparables. The Meritech dataset has 106 entries, but you might prefer a more representative thirty entries.
How to filter out old email from inbox
Every few years I take a pass at reducing the chaos in my personal inboxes. There are simply too many emails to deal with, and that generally leads to me increasingly failing to follow up on important email.
Up to this point, my strategy has largely been filtering out emails that I never want to read. But there’s another category of email which is stuff I often want to read when it’s fresh, but never want to read after it’s fresh. For example, calendar reminders, some mailing lists, some news letters, etc.
I decided to figure out how I could setup a system where I could mark a number of things as “filter three days after receipt”. This is a nice compromise, because I do want to see those things, but I don’t want to have to remember to archive them after the fact.
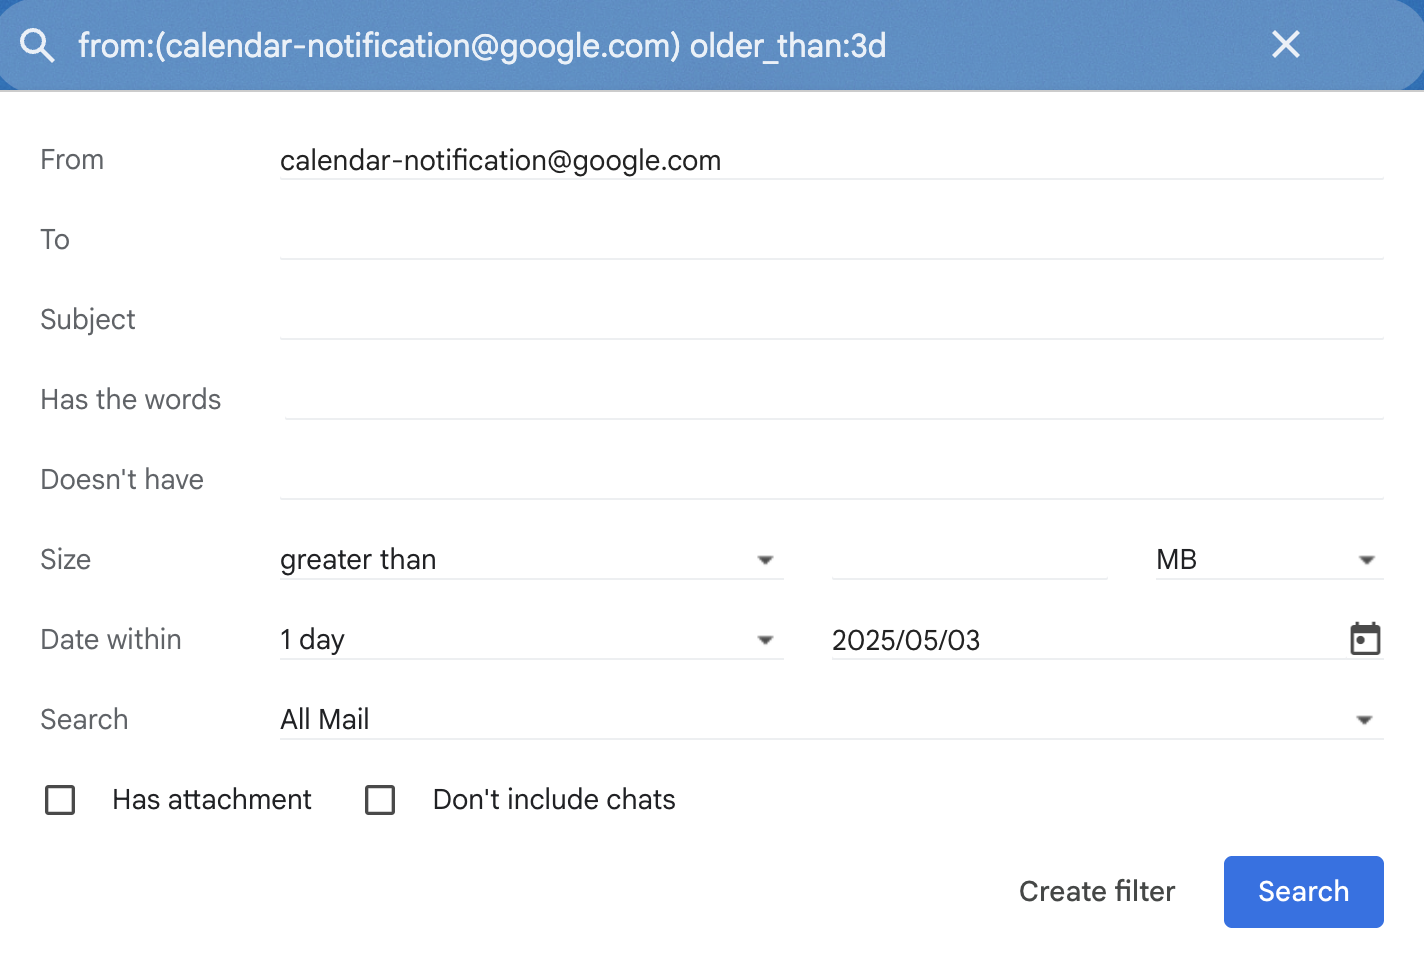
You can write a search query for this in GMail:
from:(calendar-notification@google.com) older_than:3d
However, if you try to create a GMail filter using that,
it turns the older_than:3d into a fixed point in time
rather than doing what you want.
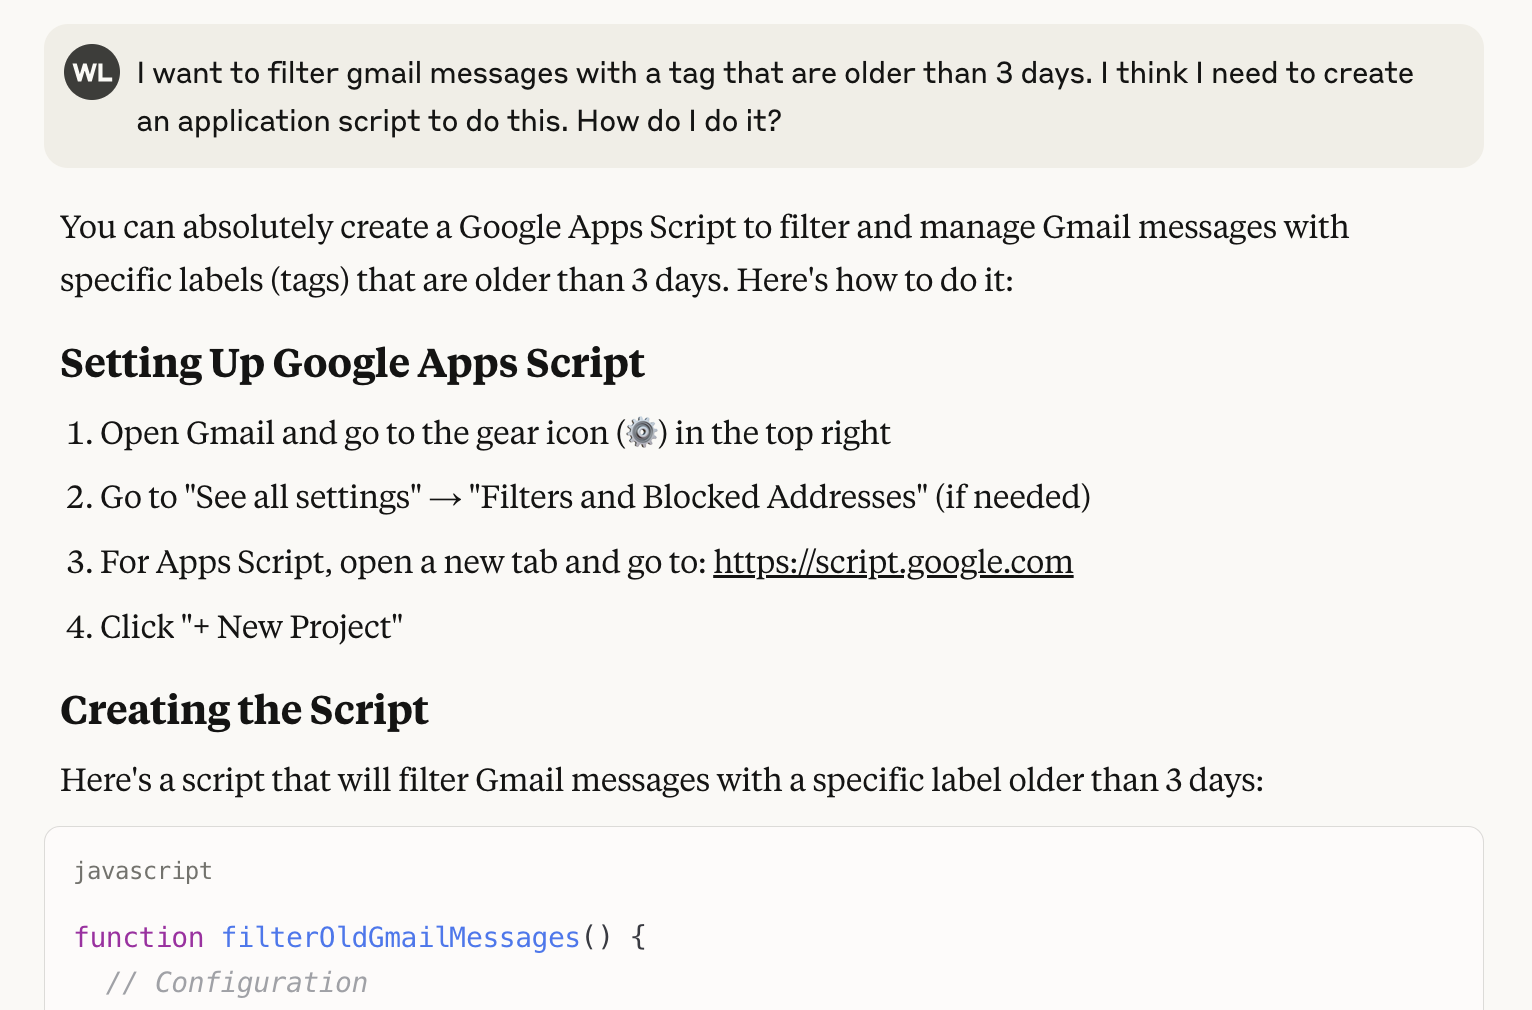
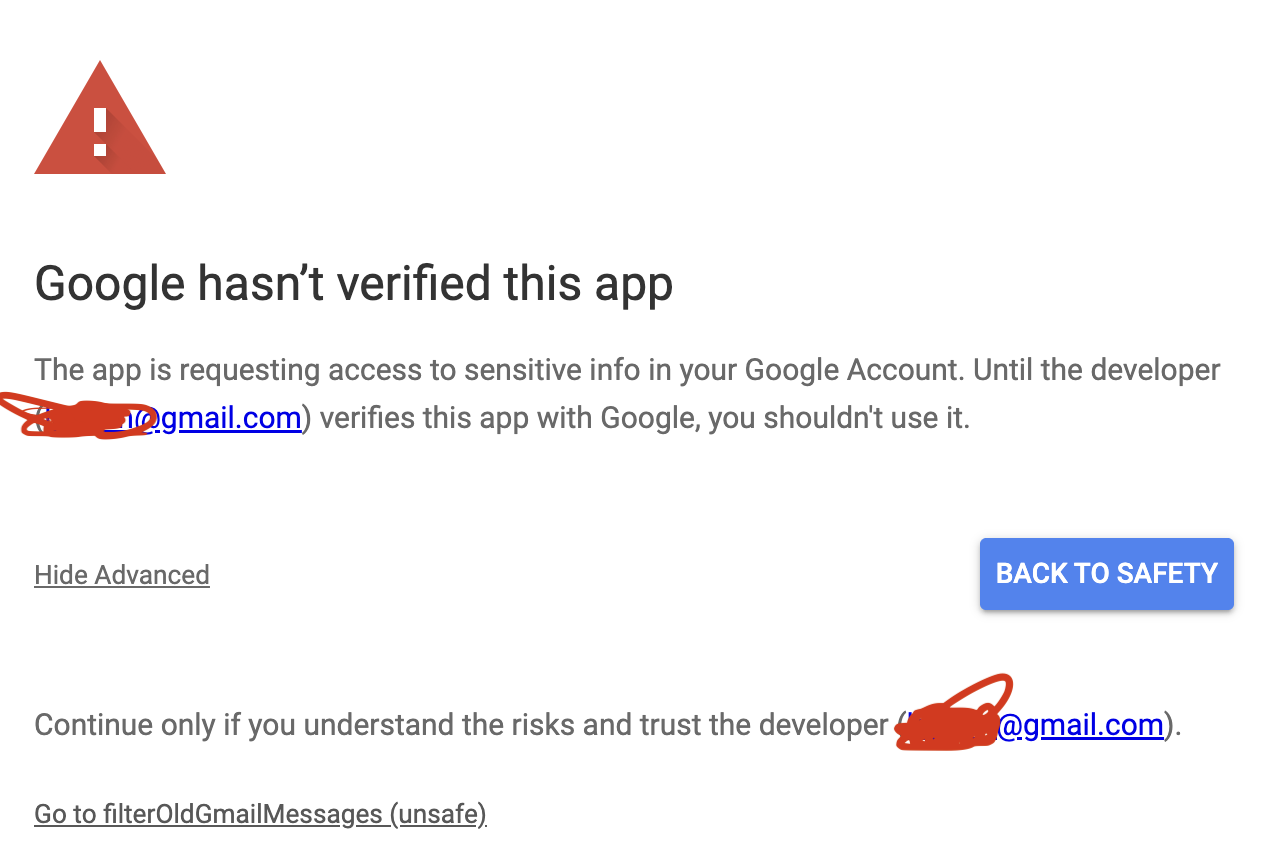
It seems that this is unsolvable within GMail itself. However, some quick searching suggested it was possible to create a Google App Script to solve this, and asked Claude to write the script for me.
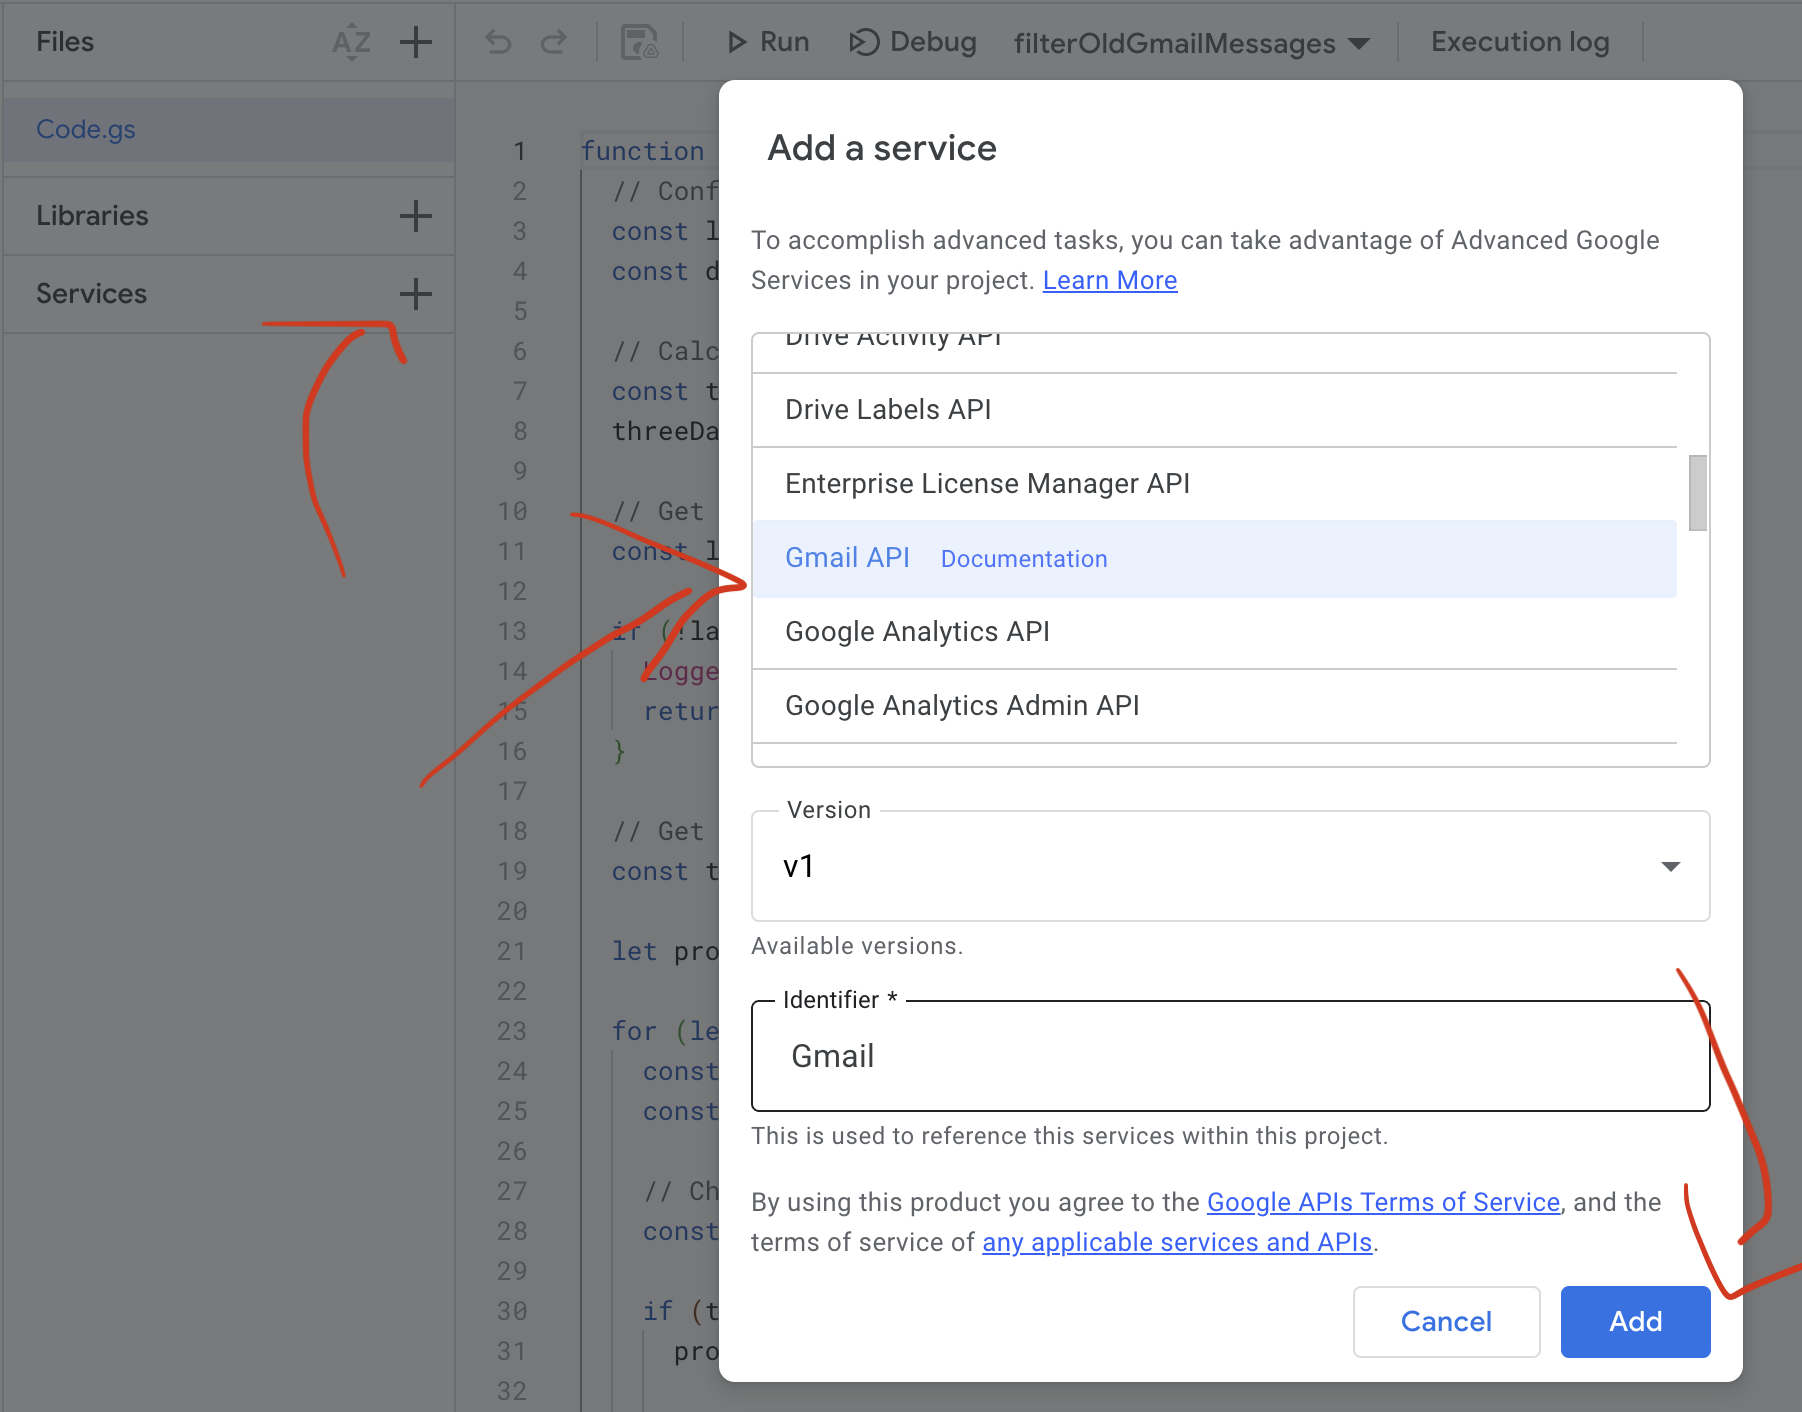
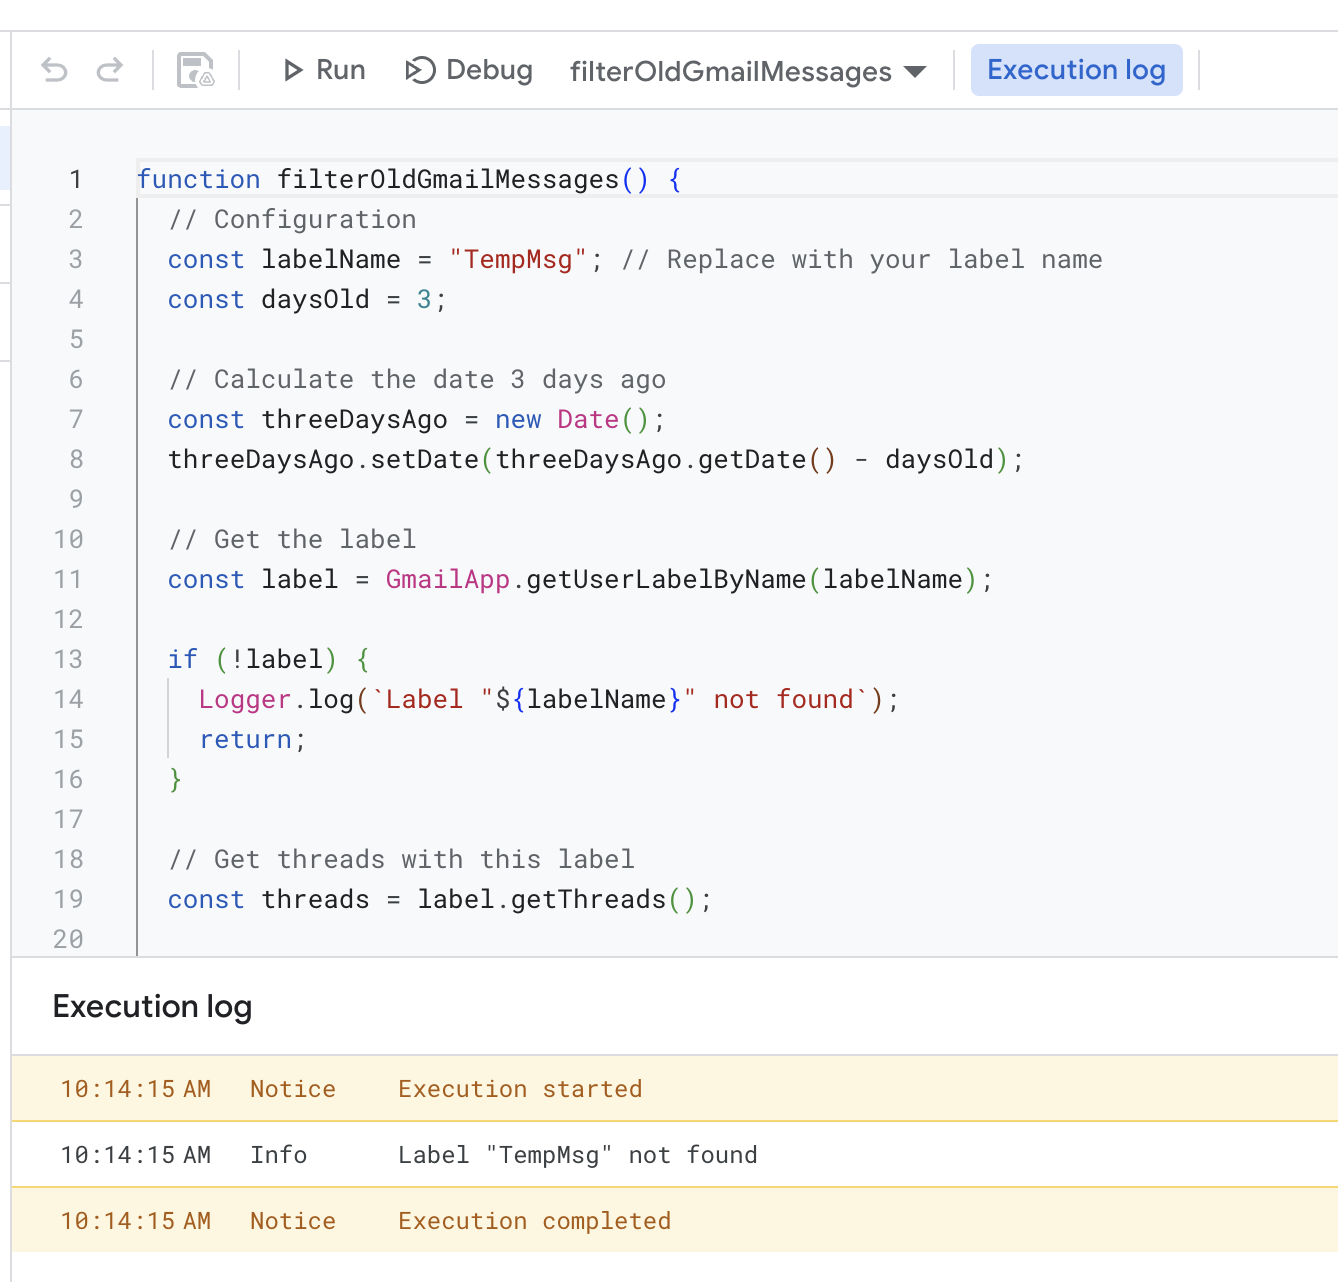
Following those instructions, I went to script.google.com, which I have not gone to in many years. I edited the generated script from Claude to use the tag “TempMsg”, to archive messages (as originally it had those commented out), and to limit itself to the first fifty items matching that tag. You can find the full code in this gist.
I attempted to run this as is, and got an error message that I needed to grant permissions. That requires three clicks within the Google Scripts UI.
This also requires approving the somewhat scary message that I trust myself.
From there I tried to run this script, and it failed because the TempMsg
tag doesn’t exist in my inbox.
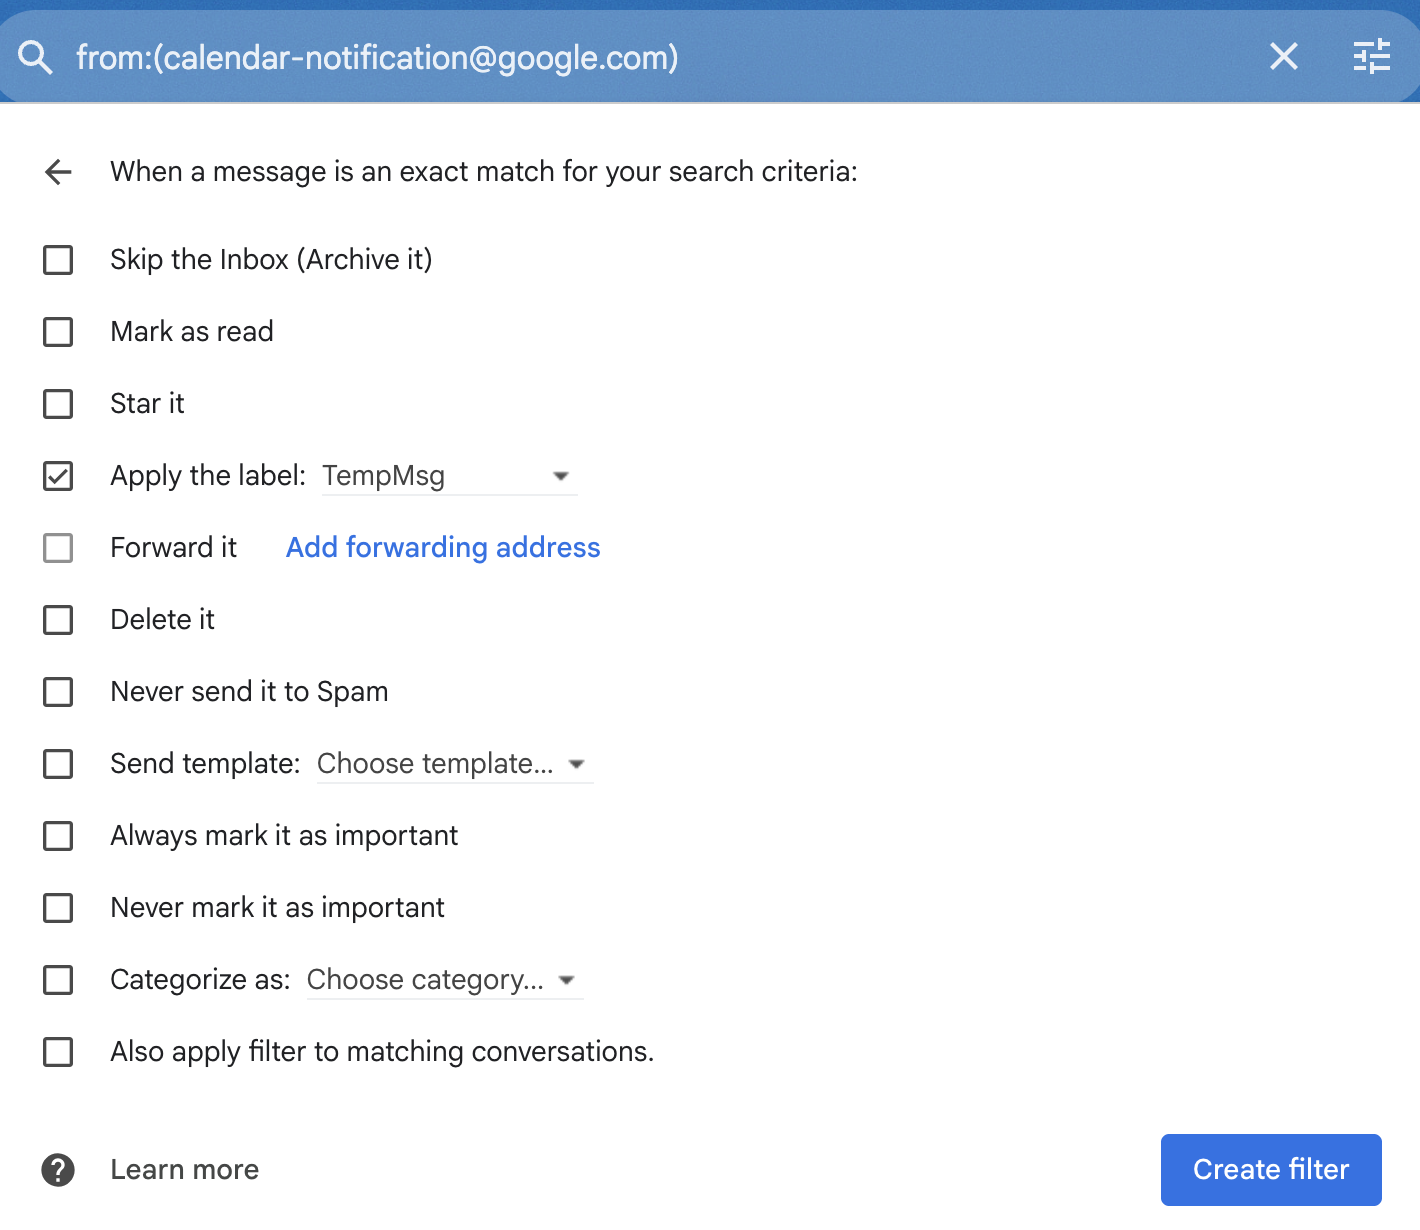
So I went ahead and created that tag, and setup some filters to assign that tag to certain email senders.
After that, I was able to run the script and it worked properly. Note that I convinced myself that it was failing for a bit, because it doesn’t remove messages from the past three days. That is exactly how it’s supposed to work, but I would run it and then see messages with the tag there and think it was failing. Woops.
After convincing myself it was working, I added a periodic trigger to run this.
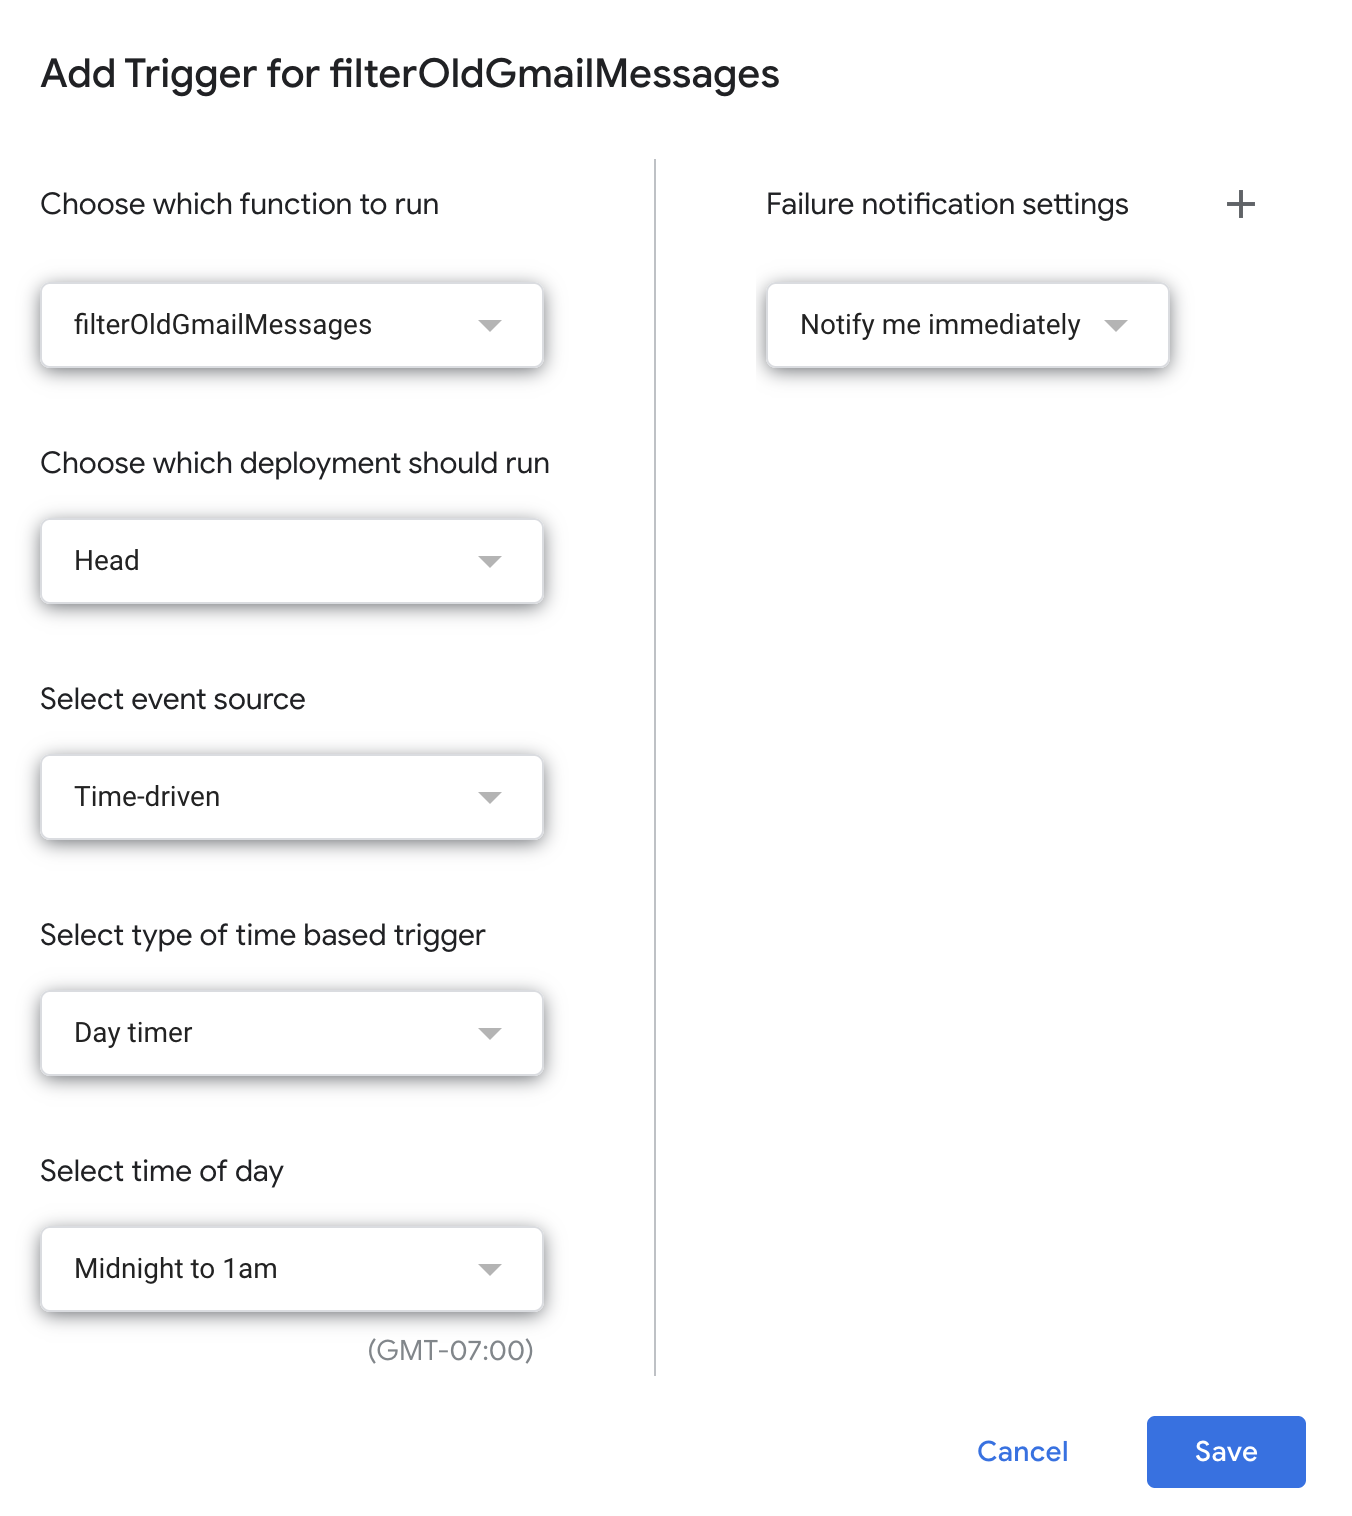
I now have this running on a daily basis, and it’s given me a nice new tool
for managing my email a bit better. After verifying it, I also used the tag
manager to “hide” this tag in the inbox, so I don’t have to see the TempMsg
tag everywhere. If I ever need to debug things, I can always make it visible again.
That's all for now! Hope to hear your thoughts on Twitter at @lethain!
|